Gold Breaks Below $4,500 as Fed's Hawkish Hold Kills Rate Cut Bets
The Federal Reserve held rates at 3.50-3.75% on March 18 and slashed its dot plot to just one cut for 2026, far below the three the market had priced. Gold responded by breaking below $4,500 for the first time since early February, posting its worst weekly decline since March 2020 as the 10-year yield jumped to 4.25% and the dollar index hit a 10-month high.
Mover Brief
The Fed's Hawkish Hold
The Federal Reserve held rates steady at 3.50–3.75% on March 18 in an 11-1 vote, with Governor Stephen Miran the lone dissent in favor of a cut. The decision itself was expected. What caught the market flat-footed was the updated dot plot: the median projection now shows just one rate cut for the remainder of 2026, down from two in December — and far below the three cuts futures markets had priced.
The year-end federal funds rate projection jumped to 3.4% from 2.9% in December 2025. The Fed raised its PCE inflation forecast to 2.7% for both headline and core, citing "cost-push" inflation from persistent geopolitical volatility and structural shifts in global energy costs. Chair Powell noted that short-term inflation expectations have risen in recent weeks due to Middle East developments.
For gold, the math is simple. The metal pays no yield. When the Fed signals that real rates will stay elevated longer than expected, the opportunity cost of holding gold spikes — and holders sell.
Dollar, Yields, and Forced Selling
The hawkish hold triggered a chain reaction across macro assets. The 10-year Treasury yield climbed to 4.25%, its highest level since the fall. The Dollar Index pushed toward 99.9, a 10-month high, putting direct inverse pressure on dollar-denominated gold.
The inflation picture made things worse for bullion, not better. February PPI came in at +0.7%, above consensus. Brent crude is trading near $100 a barrel on Middle East supply disruption fears after Iran threatened to close the Strait of Hormuz. Higher oil feeds directly into inflation expectations, which pushes rate cut timelines further out — some desks now see September 2026 as the earliest possible cut.
The positioning unwind has been severe. SPDR Gold Trust holdings fell 4.86 metric tons on Thursday to 1,062.13 metric tons, their lowest since December 17, marking six consecutive daily declines. In the futures market, leveraged longs faced margin calls as the dollar strengthened, forcing liquidation of gold positions to raise cash — a dynamic where the paper market drives price below what physical demand would justify.
Where Gold Sits Now
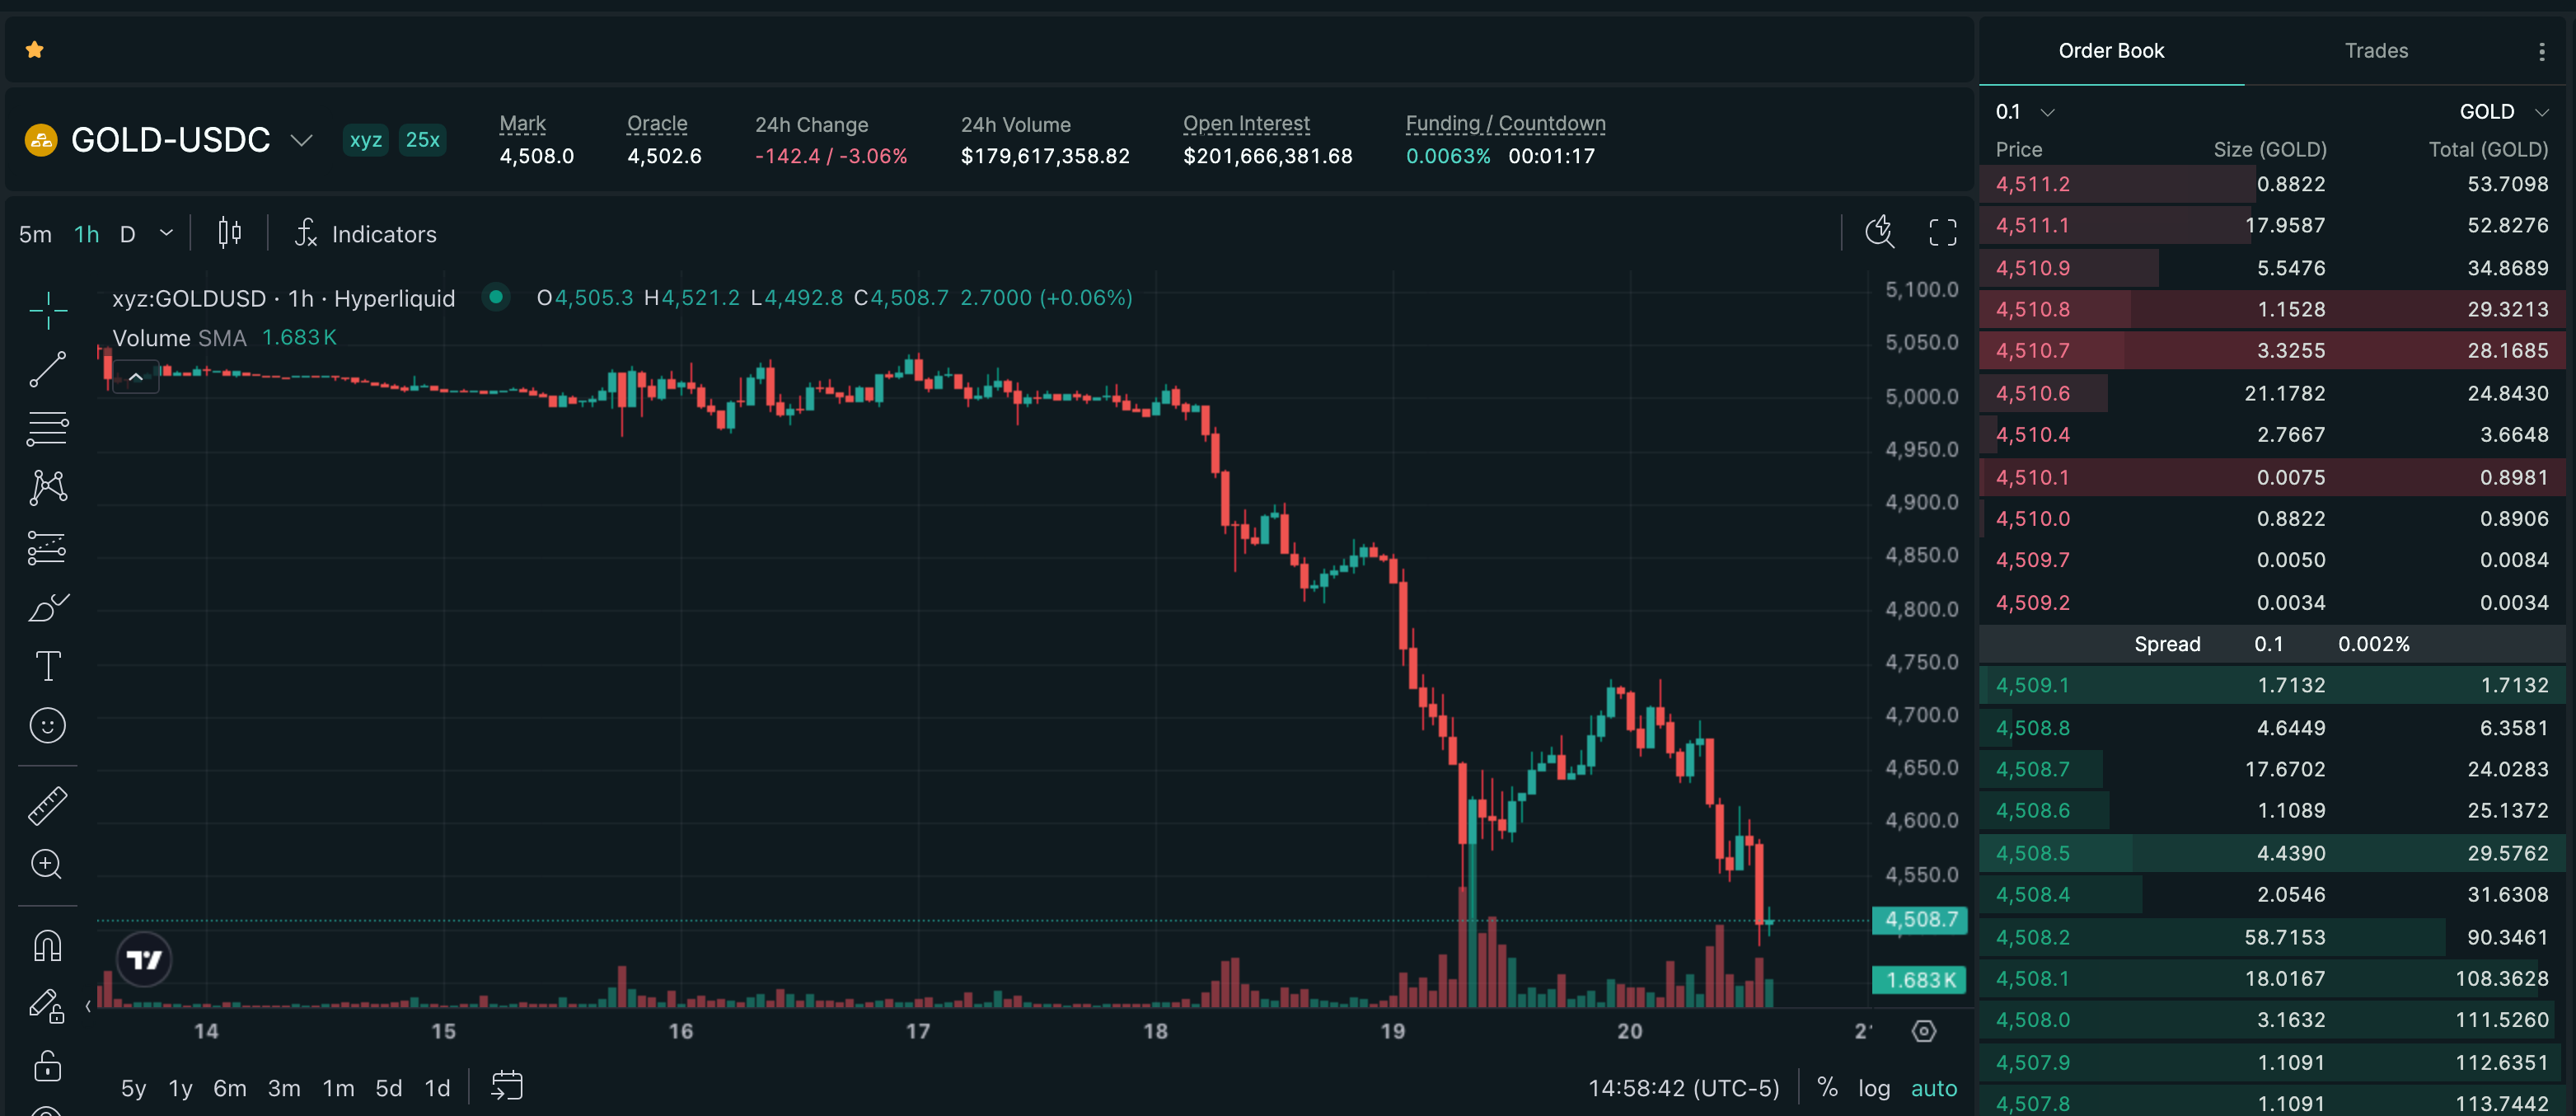
Gold hit a six-week low of $4,502.81 on Thursday, its third consecutive weekly decline and the worst week for the metal since March 2020. From the January all-time high of $5,589, gold is now down roughly 19%.
The immediate support level being tested is $4,500. Below that, prior consolidation around $4,360 and the 200-day EMA at $4,200 represent the technical bull/bear dividing line — a break below $4,200 would be the first in years and would likely trigger another wave of systematic selling.
The structural bull case has not changed. J.P. Morgan still targets $5,000 by Q4 2026. Goldman Sachs is at $6,000. Central banks are still buying. But for now, the market is repricing duration — and as Nicholas Frappell of ABC Refinery put it, "market participants have been more inclined to sell rallies rather than buy dips."
Sources & Provenance
Citations below are preserved as structured Postgres source rows for this brief.
Citations Preserved
6
Reference links carried forward from the published mover record.
Original Signal
Open source tweetMarket Route
Direct route preserved for readers who want to inspect the tracked Hyperliquid market behind this archive entry.
Already onboarded? Open tracked market- 1CNBC — Fed interest rate decision March 2026cnbc.com
- 2MarketMinute — Gold and Silver Crushed as Fed's Hawkish Hold Reshapes 2026 Outlookmarkets.financialcontent.com
- 3Finance Magnates — Why Is Gold Crashing? How Low Can XAU/USD Gofinancemagnates.com
- 4Economies.com — Gold About to Mark Worst Weekly Loss Since 2020economies.com
- 5GoldSilver — Gold Price Drop March 2026: Why Gold Fell During an Oil Shockgoldsilver.com
- 6Yahoo Finance — Fed meeting live updates: Federal Reserve holds rates steadyfinance.yahoo.com
This content is for informational purposes only and does not constitute financial advice. Trading perpetual futures involves substantial risk of loss.
Trade GOLD on Hyperliquid
Use referral code HIPERWIRE for 4% off trading fees on your first $25M in volume.
Live Market Metrics
Monitor real-time open interest and funding for GOLD.