Silver's Weekend Bounce Collapses as $67 Support Gives Way
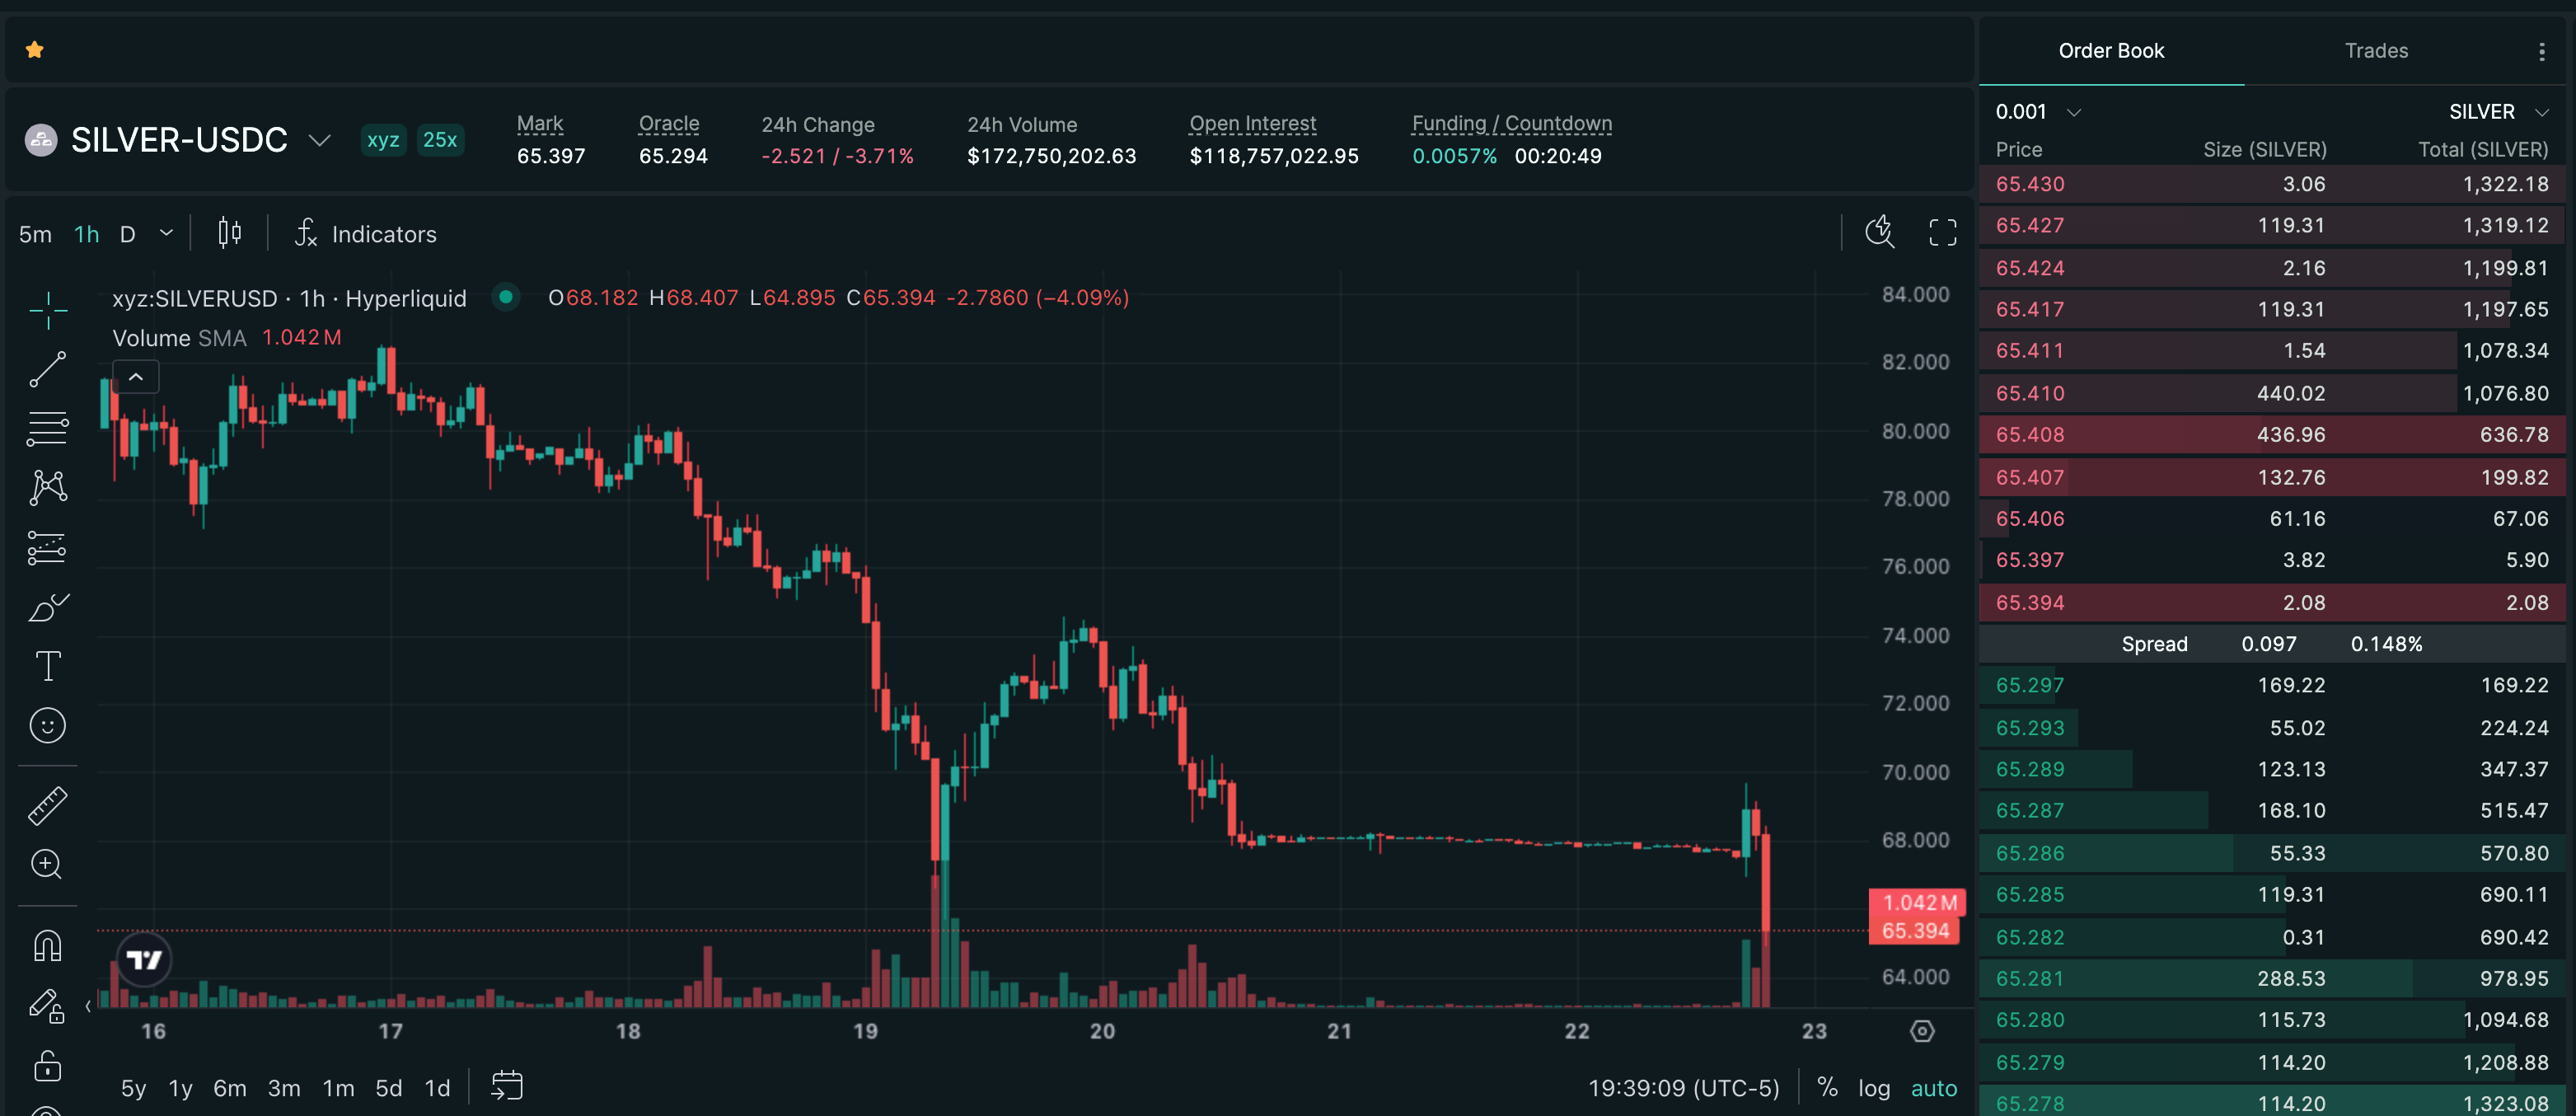
Silver's brief recovery to $69.49 on Saturday lasted less than 24 hours before the metal dropped to $65.35, breaking below the $67 floor that had held through four tests since the post-FOMC selloff began. The failure marks a new correction low, extending the decline to 46% from January's $121 all-time high. No fresh catalyst drove the breakdown — thin Sunday futures liquidity and the same macro loop that crushed silver all week did the work.
Mover Brief
The Bounce That Died
Saturday's move to $69.49 looked like seller exhaustion — five straight red sessions, managed-money net longs drawn down roughly 90% from their mid-2025 peak, and a thin weekend book that let a small bid push the price. It wasn't enough.
Silver gave back the entire bounce and then some, dropping 5.19% to $65.35 in a two-hour window on Sunday evening. The pattern is a textbook failed rally in a downtrend: the bounce couldn't reclaim $70, couldn't attract follow-through buying, and collapsed the moment new selling arrived.
SLV has bled over $3.6 billion year-to-date, with $713 million exiting in the most recent week and $835 million the week before. The ETF redemption machine that kicked in after the March 18 FOMC hawkish hold is still running. Each round of fund liquidation generates fresh futures selling pressure that feeds back into the paper price — a self-reinforcing loop that weekend bounces can't interrupt.
Below $67 for the First Time
The $67 level had held four tests since the selloff began on March 18. Silver touched $66.93 intraday on March 19 during the post-FOMC flash crash and bounced. Hit $68 on March 20 during the ETF exodus and bounced. Closed at $67.79 on Friday. Each test weakened the floor, and this one broke through it.
At $65.35, the next reference point is the 200-day moving average near $62, which analysts have flagged as the next structural support. Below that, the October 2025 highs around $55 are the last major level before silver's technical picture deteriorates further. The metal is now down 46% from January's $121 all-time high.
The perp-to-spot gap continues to widen. The Hyperliquid perp trades at $65.35 while spot references sit higher, the same dynamic seen all week as derivative markets absorb the full force of paper liquidation while physical demand holds. COMEX registered inventory coverage remains near historical lows, and the Silver Institute projects a sixth consecutive annual supply deficit — the physical market is not confirming this price.
Same Chain, No Breaks
The macro transmission chain driving silver lower since March 18 remains fully intact. Iran's strike on Qatar's Ras Laffan LNG complex keeps Brent above $114. Elevated energy prices feed inflation, validating the Fed's hawkish posture. The dot plot shows one cut for 2026 with rates at 3.50–3.75%. Ten-year Treasury yields at 4.25% make non-yielding metals expensive to hold. The DXY above 99 compresses silver for every non-USD buyer.
For the selloff to reverse, one of those links needs to snap. The next FOMC meeting isn't until May. Iran has rejected ceasefire talks. There is no policy catalyst on the calendar that could shift the rate outlook, and no sign of de-escalation that could pull oil lower. The growing physical-paper divergence and low COMEX inventory coverage remain tail risks worth monitoring — but the base case is that this correction has room to continue until the macro inputs change.
Sources & Provenance
Citations below are preserved as structured Postgres source rows for this brief.
Citations Preserved
6
Reference links carried forward from the published mover record.
Original Signal
Open source tweetMarket Route
Direct route preserved for readers who want to inspect the tracked Hyperliquid market behind this archive entry.
Already onboarded? Open tracked market- 1FinancialContent — Gold and Silver Crushed as Fed's Hawkish Hold Reshapes 2026 Outlookmarkets.financialcontent.com
- 2FinancialContent — ETF Exodus: Investors Flee Gold and Silver Funds for Rising Treasury Yieldsmarkets.financialcontent.com
- 3Finance Magnates — Why Silver Is Crashing: How Low Can XAG/USD Gofinancemagnates.com
- 4Ad Hoc News — Silver Crashes 45% from 2026 Peak Amid Fed Hawkishness and SLV Exodusad-hoc-news.de
- 5Silver Institute — Global Silver Investment Strong Against Sixth Annual Deficitsilverinstitute.org
- 6Crux Investor — Why Gold and Silver Suddenly Sold Off and What It Meanscruxinvestor.com
This content is for informational purposes only and does not constitute financial advice. Trading perpetual futures involves substantial risk of loss.
Trade SILVER on Hyperliquid
Use referral code HIPERWIRE for 4% off trading fees on your first $25M in volume.
Live Market Metrics
Monitor real-time open interest and funding for SILVER.