Silver Slides Below $70 as Thin Weekend Liquidity Meets DXY at 100
Silver dropped 2.69% in two hours on Sunday evening, falling to $68.08 as thin weekend order books amplified selling pressure. The move extends what is already silver's worst month in 46 years — down roughly 28% in March — with the dollar index holding above 100 and no confirmed single catalyst behind the leg lower.
Mover Brief
The Move
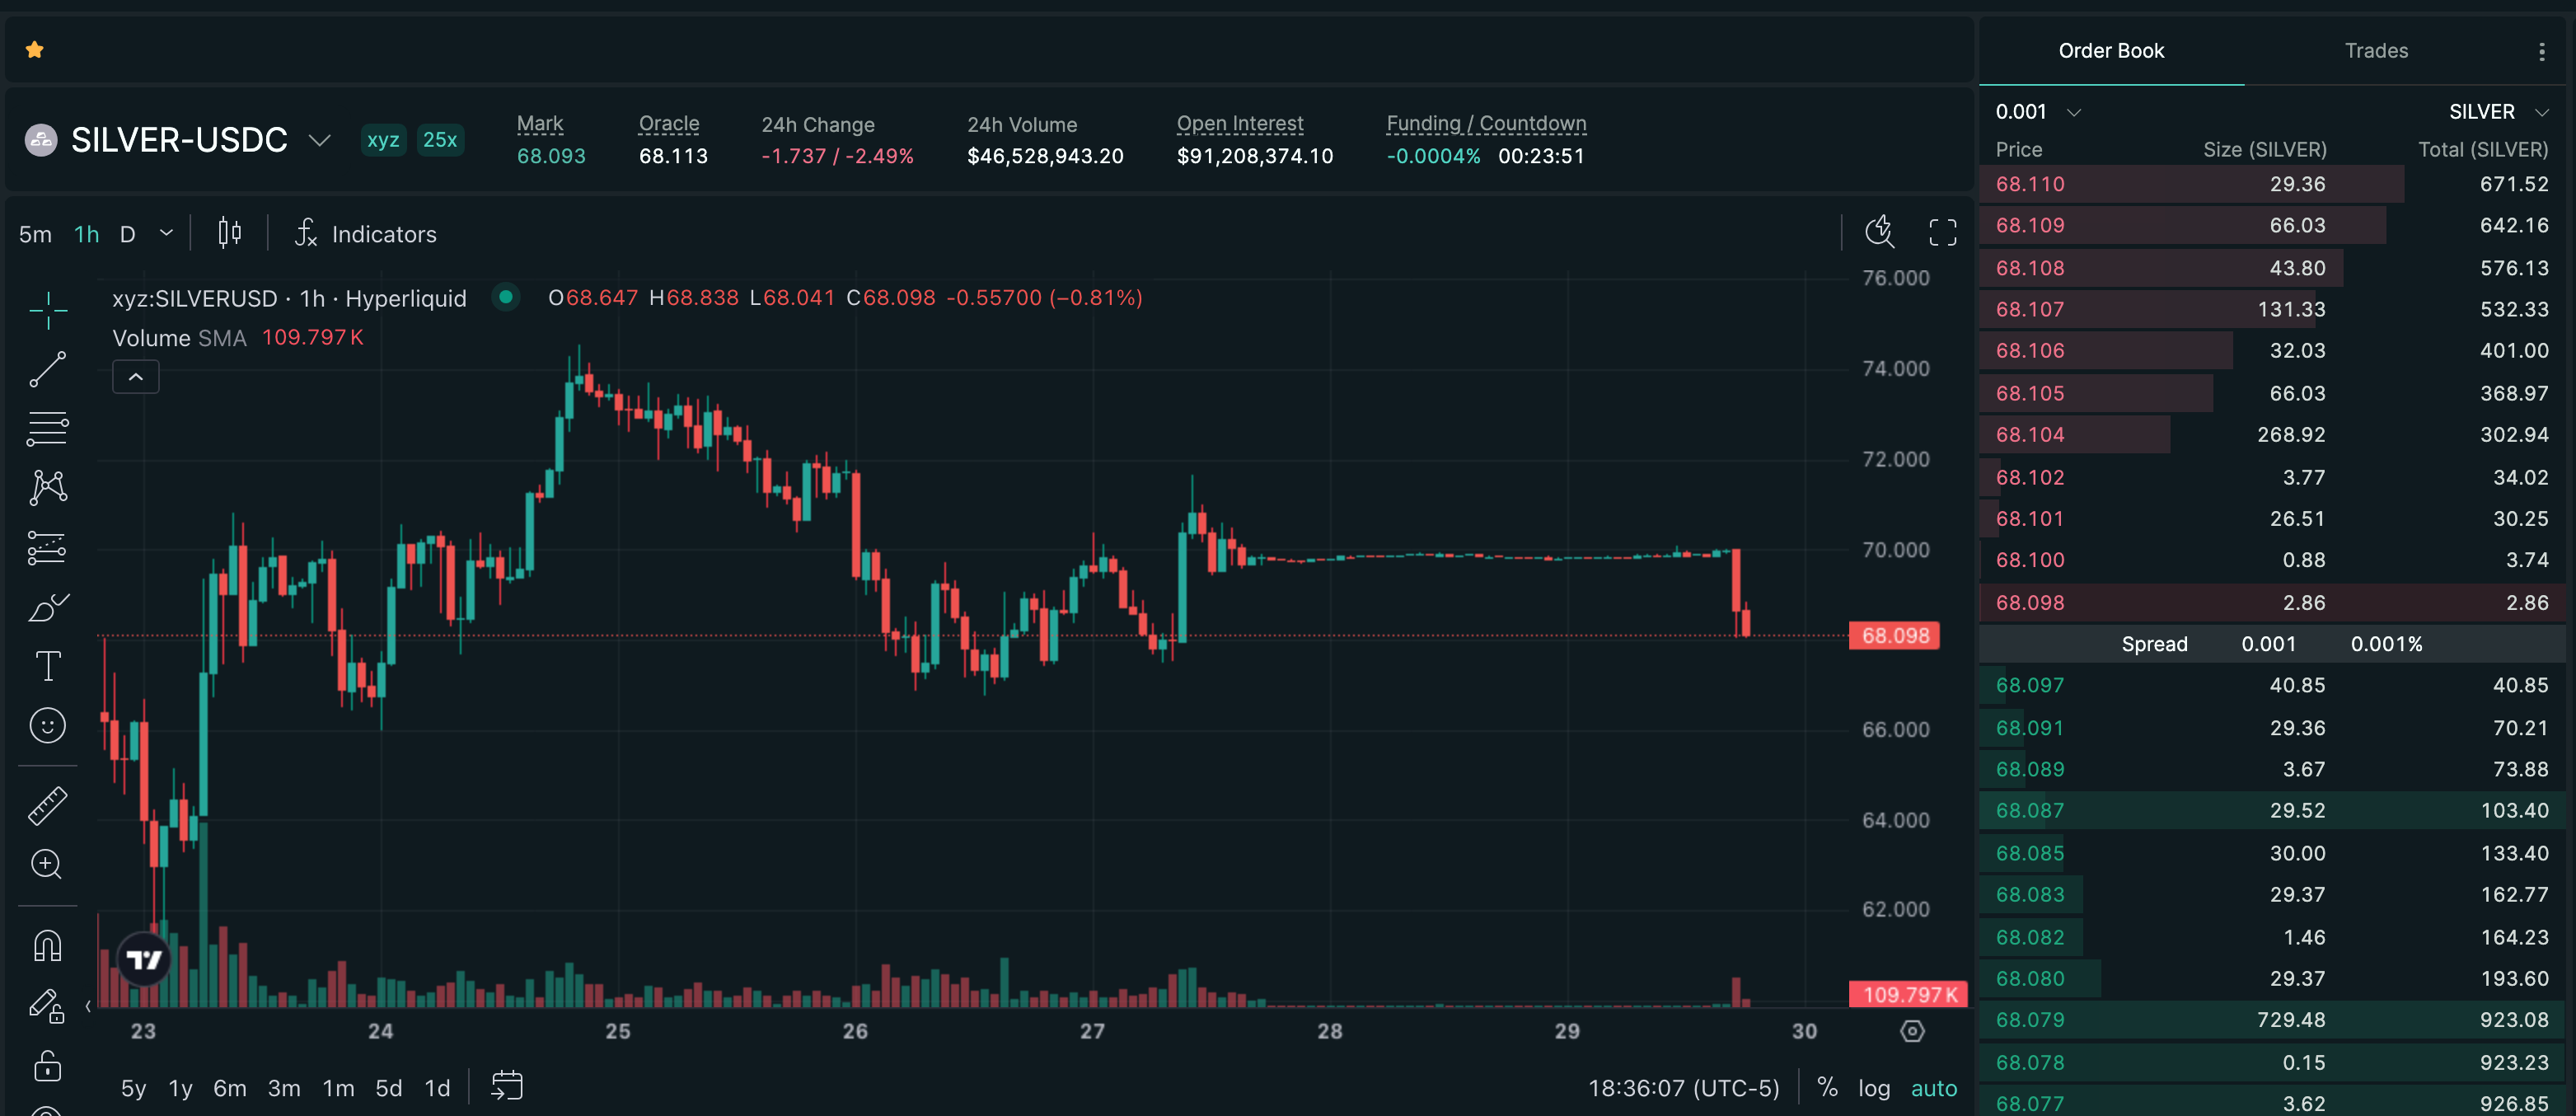
Silver slipped from roughly $69.96 to $68.08 in a two-hour window on Sunday evening UTC — a 2.69% drop with no single identifiable catalyst. The timing matters: weekend perp markets run on a fraction of weekday depth, and silver's order book has been especially thin as suppliers sit on the sidelines and transactions dry up heading into month-end. A modest sell into that kind of book prints an outsized candle.
The dollar index held at 100.32, up 0.16% on the session and on track for a weekly gain of around 0.3%. That's a persistent headwind for a non-yielding metal already under pressure. Silver had rejected hard at $72 resistance on March 26, and the failure to reclaim $70 — a key psychological level flagged by multiple analysts — left the path of least resistance lower going into the weekend.
Silver's Worst Month in 46 Years
This leg lower is a footnote in a much larger story. Silver is down over 28% in March 2026, the largest single-month decline since 1980. From January's all-time high of $121.64, the metal has now lost 44%.
The macro setup is hostile on every axis. Kevin Warsh's nomination as Fed Chair shifted rate expectations sharply hawkish; zero cuts are now priced for 2026, versus three expected earlier in the year. Real Treasury yields have jumped to 4.2%. Meanwhile the Iran war pushed WTI above $107, feeding an oil-inflation-dollar feedback loop that has overridden silver's traditional safe-haven bid. SLV has bled $3.6 billion in outflows year-to-date as money rotates into Treasuries yielding 4.25%.
The Physical Disconnect
The paper selloff has not resolved the physical shortage underneath. COMEX registered silver — the metal actually available for futures delivery — fell to 77.17 million ounces as of March 26, down from 167.7 million ounces in October 2025, a 54% drawdown in five months. At the current withdrawal rate of 1.77 million ounces per day, registered inventory has roughly 44 days of runway.
The paper-to-physical ratio sits at 7:1. March is a major delivery month, and January already signaled stress with 33–49 million ounces delivered — 7–10x the historical January average. Korea's first physical silver ETF launches March 31, adding a new demand channel into an already strained warehouse system. JPMorgan still targets $81 for silver in 2026, suggesting the selloff has overshot on the paper side even as physical tightness persists.
What to Watch
The $68 level is now the line in the sand. A clean break lower opens the door toward $61.21 — the March 23 intraday low where the heaviest wave of liquidation found a floor. Above, $70 has flipped from support to resistance, and $72 is where last week's bounce died.
Friday's PCE data is the next scheduled volatility event. A hot print reinforces the zero-cuts narrative and keeps the dollar bid; a soft print could trigger a positioning unwind in what is now a very crowded short. With COMEX registered inventory draining at this pace and month-end rebalancing flows hitting thin books, silver is set up for continued two-way violence.
Sources & Provenance
Citations below are preserved as structured Postgres source rows for this brief.
Citations Preserved
6
Reference links carried forward from the published mover record.
Original Signal
Open source tweetMarket Route
Direct route preserved for readers who want to inspect the tracked Hyperliquid market behind this archive entry.
Already onboarded? Open tracked market- 1FX Leaders — Silver Price Analysis, March 27 2026fxleaders.com
- 2GoldSilver — Why Gold Fell During an Oil Shock, March 2026goldsilver.com
- 3J.P. Morgan — Silver Price Forecast 2026jpmorgan.com
- 4Trading Economics — US Dollar Indextradingeconomics.com
- 5Austin & Matt — COMEX Warehouse Dataaustinandmatt.com
- 6Silver Phoenix 500 — Silver Price Update March 29 2026silver-phoenix500.com
This content is for informational purposes only and does not constitute financial advice. Trading perpetual futures involves substantial risk of loss.
Trade SILVER on Hyperliquid
Use referral code HIPERWIRE for 4% off trading fees on your first $25M in volume.
Live Market Metrics
Monitor real-time open interest and funding for SILVER.