Silver Fades to $60 as the Record Deficit That Backstopped the Bull Case Gets Cut 80%
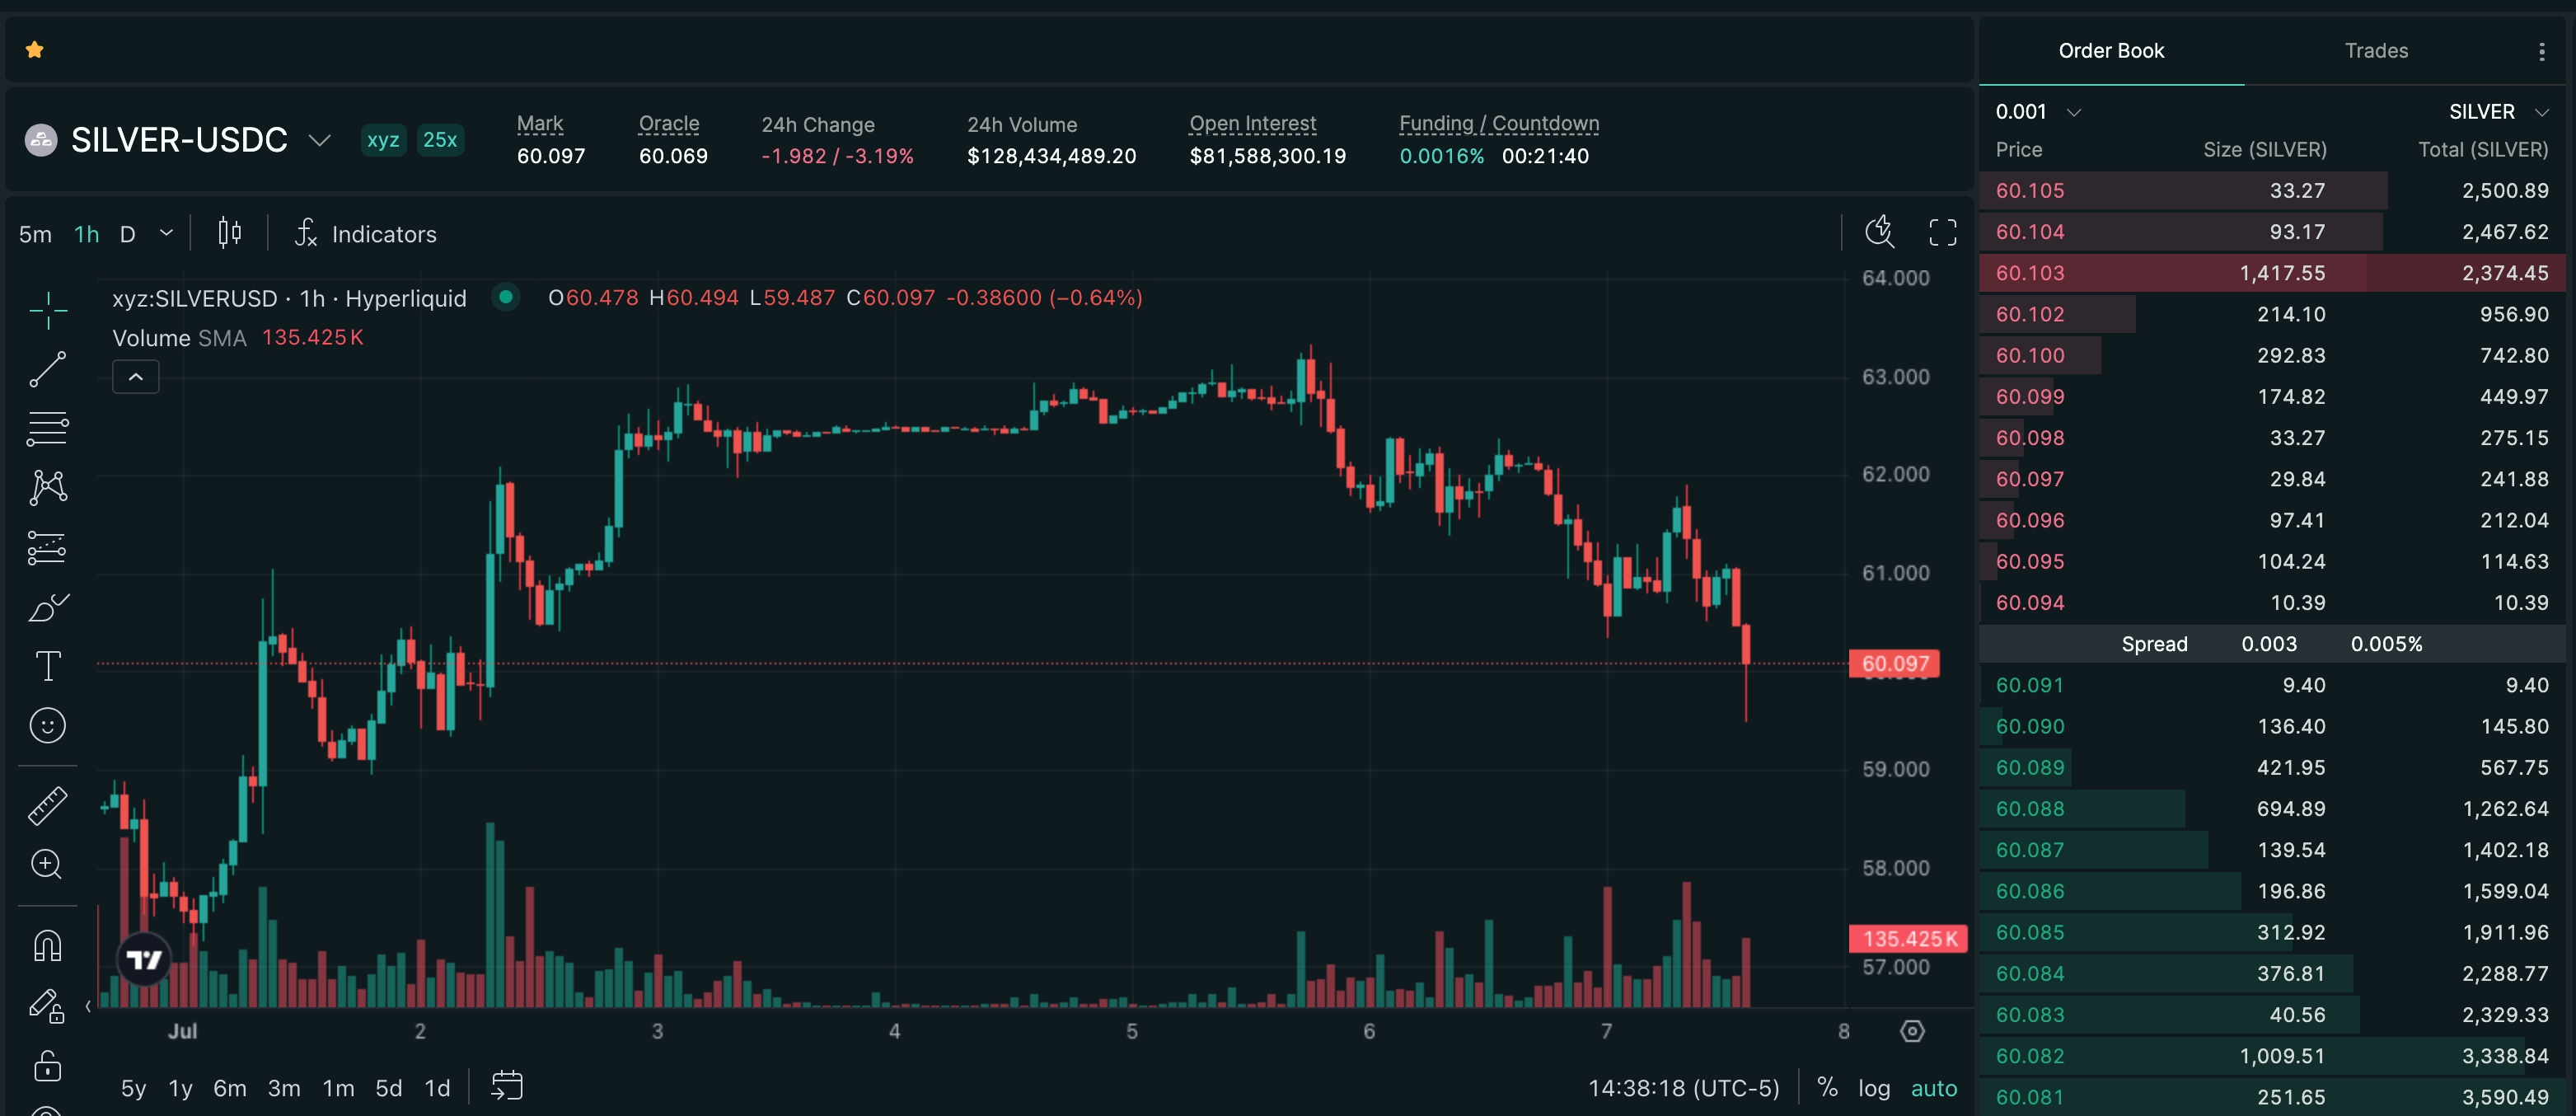
SILVER is back at the $60 line, down 3.39% on no fresh headline. The move is just the 2026 correction grinding lower, but the deeper problem is structural: UBS has cut its 2026 supply deficit forecast by roughly 80%, gutting the one bull argument that survived after the rate trade broke. With both the macro backdrop and the deficit story working against it, $60 is the level that matters.
Mover Brief
No Fresh Catalyst, Just a Correction Looking for a Floor
There is no single headline behind SILVER's 3.39% slide to $60.05 — this is the same 2026 correction still grinding lower. Spot silver printed around $61.36 on July 7, down 1.03% on the day and 9.43% over the prior month, and the perp is sitting right on the $60 line that HIPERWIRE flagged as the pivot in its last two notes. Zoom out and the scale of the unwind is the story: silver topped near $120 an ounce in January before the correction began, so a print at $60 is roughly a halving from the peak.
The macro backdrop hasn't gotten any friendlier. The January 30 nomination of Kevin Warsh as Fed chair triggered an immediate 27% crash in silver alongside a 10% drop in gold as renewed dollar confidence pulled the rug from a zero-yield metal. That rate trade is still the ambient pressure here — a firmer dollar and higher-for-longer expectations leave nothing bidding a non-yielding asset at these levels.
The Deficit Was the Fallback — Now UBS Has Cut It 80%
After the rate trade broke silver's momentum, bulls fell back on the one argument that felt untouchable: the record physical supply deficit. That fallback is now being taken away. In May, UBS slashed its 2026 supply deficit forecast to roughly 60–70 million ounces, down from a prior estimate near 300 million — an ~80% cut to the exact scarcity thesis that justified triple-digit price targets.
Strategists Wayne Gordon and Dominic Schnider pointed to weaker photovoltaic, jewelry and silverware demand, a roughly 70-million-ounce drop in ETF holdings, and firmer mine supply. UBS trimmed its price targets across every horizon and moved its base case to broadly sideways. That matters more than any one day's tape: when the deficit was the reason to hold through the drawdown, halving the deficit removes the reason to hold.
High Prices Killed Their Own Demand
The mechanism behind the shrinking deficit is the classic commodity trap — the cure for high prices is high prices. Industrial use is about 60% of silver demand, with solar the fastest-growing slice, up from 80 million ounces in 2016 to roughly 200 million now. But at these levels silver has become over 30% of a solar panel's cost versus historical levels near 1.5%, pushing manufacturers toward copper, base-metal substitutes and even silverless panel designs.
That's the demand destruction now showing up in the revised balance. It doesn't kill the long-term case — J.P. Morgan still models silver averaging $81 an ounce in 2026, more than double the 2025 average — but it explains why the spot market can't hold a bid: the same price spike that made the bull thesis loud is quietly eroding the demand underneath it.
The Level That Matters
$60 is doing real work as a line. HIPERWIRE's last note flagged that a positioning-driven bounce back to $60 only counts if the level actually holds, and this slide is the market testing exactly that. Below it, the next reference points are the multi-month lows the metal probed in late June and early July, when silver was struggling to reclaim ground after months of pressure.
The asymmetry for perp traders is worth naming: the structural bull case has been thinned to a sideways base case, while the drawdown from the January peak leaves plenty of room on the downside if $60 gives way. This is no longer a dip in an uptrend — it's a correction where both the macro and the supply story point the same direction until price proves otherwise.
Sources & Provenance
Citations below are preserved as structured Postgres source rows for this brief.
Citations Preserved
5
Reference links carried forward from the published mover record.
Original Signal
Open source tweetMarket Route
Direct route preserved for readers who want to inspect the tracked Hyperliquid market behind this archive entry.
Already onboarded? Open tracked market- 1Fortune — Silver price, July 7, 2026fortune.com
- 2J.P. Morgan Global Research — 2026 silver outlook, deficit and substitutionjpmorgan.com
- 3Kitco — UBS cuts 2026 silver deficit forecast to 60–70M ozkitco.com
- 4TheStreet — UBS resets silver price targets for the rest of 2026thestreet.com
- 5Yahoo Finance — Silver prices holding near $62, July 7, 2026finance.yahoo.com
This content is for informational purposes only and does not constitute financial advice. Trading perpetual futures involves substantial risk of loss.
Trade SILVER on Hyperliquid
Use referral code HIPERWIRE for 4% off trading fees on your first $25M in volume.
Live Market Metrics
Monitor real-time open interest and funding for SILVER.